Cardano Price Analysis: Is $ADA Price Ready to Reclaim $0.4 Mark?
Cardano Price Analysis: Today, the crypto market experienced increased selling pressure, leading to a downward trend in several major cryptocurrencies. As a result, the Cardano price is down 1.22% and is approaching the support trendline of the rising channel pattern. Historically, this ascending trendline has acted as an active accumulation zone for traders which usually results in a massive recovery cycle.
Also Read: Cardano Price Prediction 2023, 2025, 2030: ADA signals for upcoming surge
Cardano Price Daily Chart
- The Cardano coin price maintains an overall bullish trend until the channel pattern is intact
- A breakdown below the lower trendline will signal the resumption of the prior downtrend
- The intraday trading volume in the ADA coin is $189.5 Million, indicating an 0.97% gain
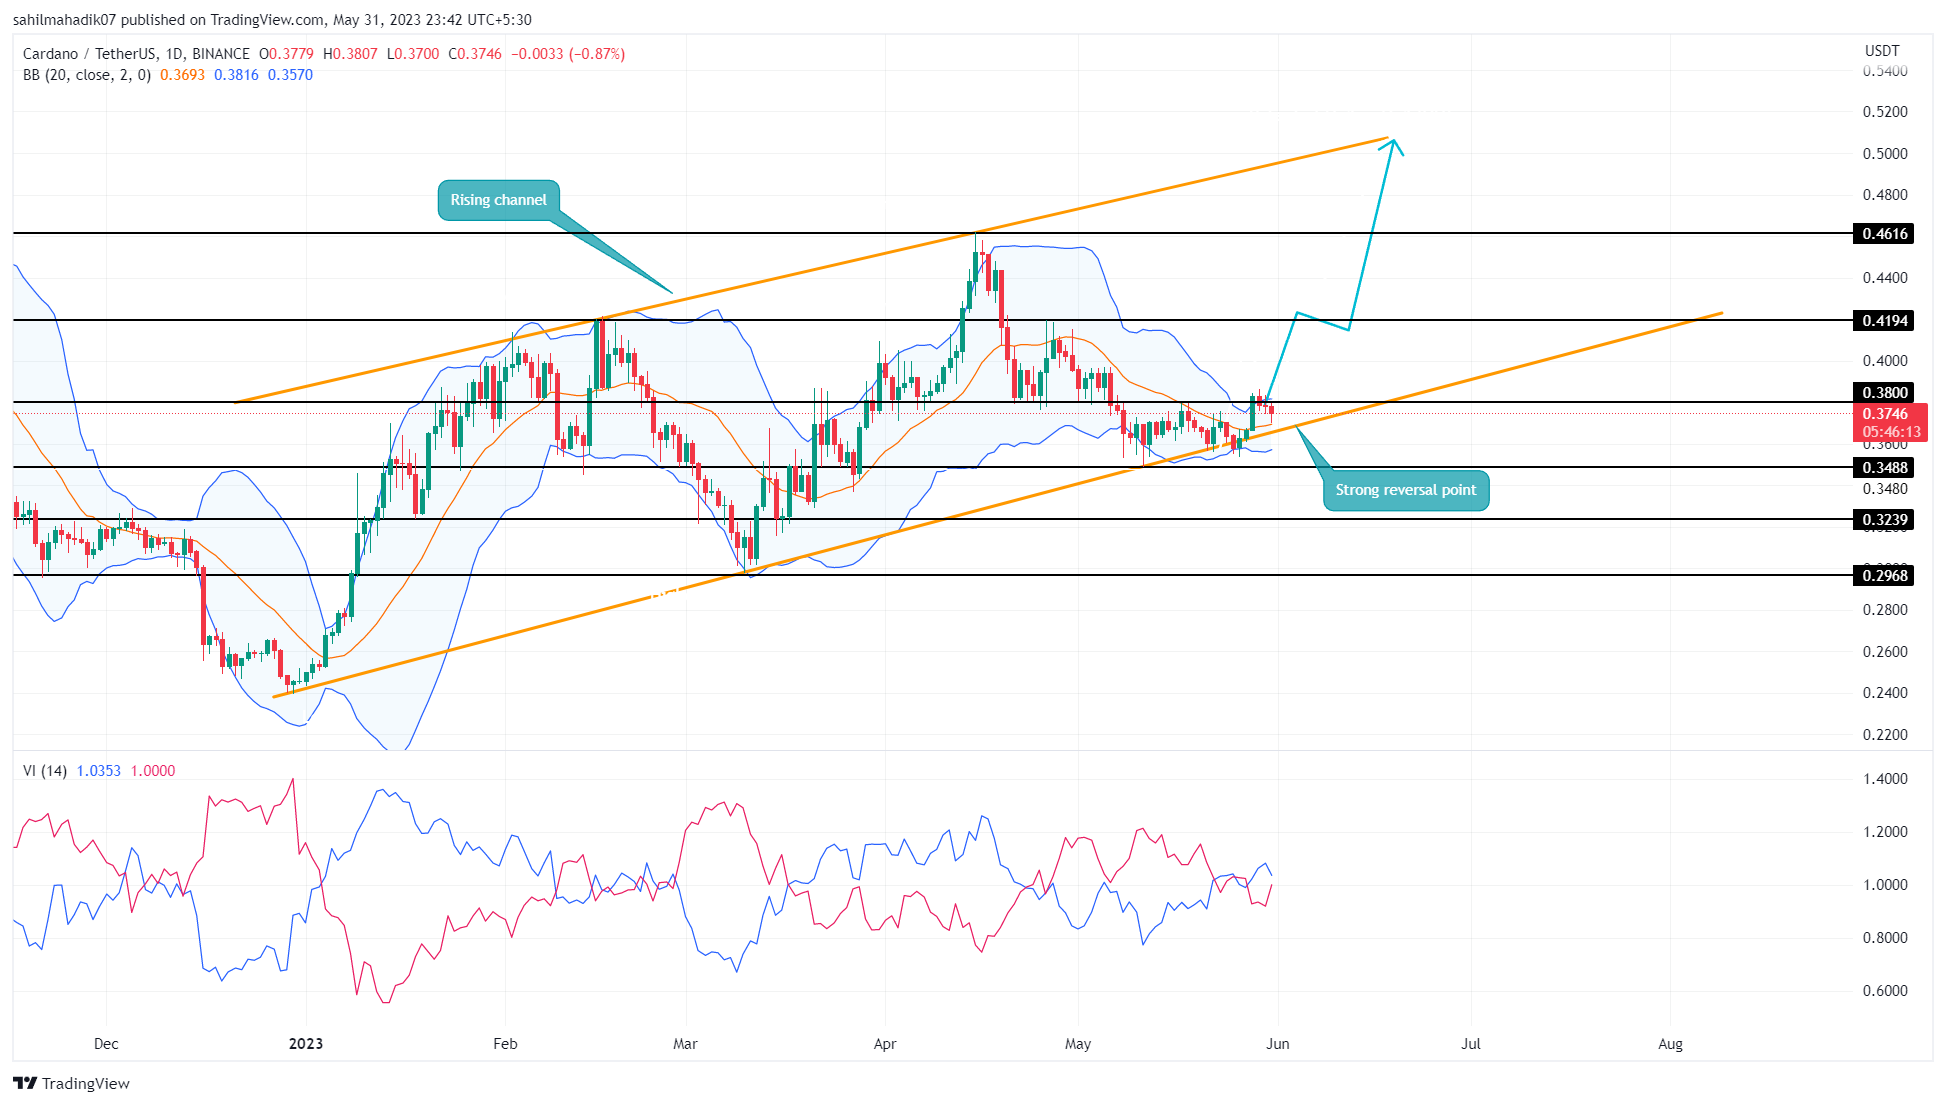
Source- Tradingview
On May 28th, the ADA price gave a bullish breakout from a local resistance of $0.38 in anticipation of kickstarting a new recovery rally. However, with the increasing selling pressure in the market, the buyers failed to sustain this level and plunged below $0.38 again.
This breakdown plummeted Cardano coin price to $0.37 and is likely to tumble another 2% to hit the ascending trendline. Over the last five months, altcoin has rebounded from this support thrice indicating a strong buying zone.
Thus, the ADA price is likely to bounce off this level and recuperate the bullish momentum. If a potential reversal occurs, the buyers may drive the prices to reach $0.42, followed by $0.46, and $0.5.
Will Cardano Price Tag $0.4 Mark?
A potential bullish reversal from the support trendline will recuperate the bullish momentum in ADA price. In theory, a reversal from a lower trendline bolsters buyers to carry a recovery cycle back to the upper trendline. Thus, the resulting recovery may push the Cardano price to the first target of $0.42.
- Bollinger band: The bands of the BB indicator squeezed significantly indicate the ADA price is currently in a highly volatile phase.
- Vortex Indicator: The VI+(blue) and VI-(orange) slope in a bullish crossover state reflect the market trend is bullish.